


How you should be reporting on content marketing ROI
Written by Lee
intro.
The awareness of how powerful and profitable content marketing can be (if executed correctly) has risen dramatically over the last five years. To deploy continued successful content marketing you have to understand performance. Reporting in any form should allow you to show the progress of a campaign as well as the return on investment for that activity, whether that is to track effort or commercials. Reporting should also allow you to analyse and refine your performance, to achieve this though you need to be reporting on the right metrics.
Engagement Metrics
To allow you to refine your content and influence the results produced from your content marketing you need to benchmark how users are interacting, the best way to do this is to use engagement metrics.
A combination of Google Analytics average time on page and scroll depth will allow you to really refine your content and make actionable changes. Average time on page tells you how long people are on the page for giving you an indication of the quality of the content, if they are hanging around for more than 10 seconds or so it is likely that they are reading your content.
Scroll Depth will back up average time on site and give you another layer of information by showing you how far down the page users are scrolling. This is really useful for understanding what length of content your audience is most responsive to. You may be creating 10,000-word guides but find that users are only scrolling down the first 25% of the page which could indicate they are overwhelmed, so you could test putting in a table of contents to provide them with the opportunity to get to the information they are most interested in, quickly.
Once you have collected a good amount of data you can then start to pull it down into excel and begin analysing the performance of your content. To give you a quick example of the data you will be able to look at, and some very rough visualisations, below is a graph plotting “unique pageviews” and “average time on page”, this allows you to see the best performing pieces of content quite easily:
The data above is dummy data simply to demonstrate how you can quickly visualise and identify the content that is performing well. In the example article 2 performs really well with high unique page views as well as high average time on page, while article 1 has a high number of unique pageviews but a low average time on page. There will be variables to consider such as content length, content type etc, but already you have some really valuable data which will help you understand what your best performing type of content is.
As mentioned above scroll depth will give you a great metric to use for analysing how users are engaging with your content by measuring how much of the page they view. Once you have scroll depth set up it will use Google Analytics events to record and report the scroll depth across your pages, you can then split out all the content you wish to analyse and start gaining some valuable learnings.
You can get to events within Google Analytics by navigating to Behaviour > Events
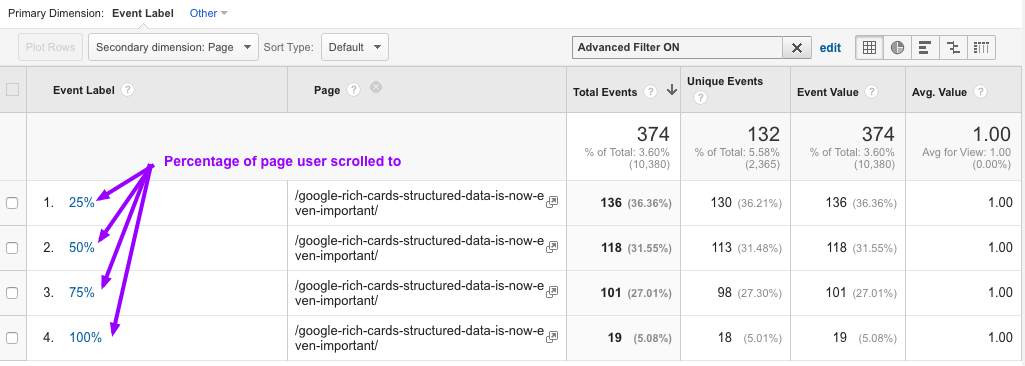
An isolated view of a recent blog post we published on Google Rich Cards shows the different levels of scroll depth as percentages, there is also a secondary dimension of “Page” applied which is included in the view:
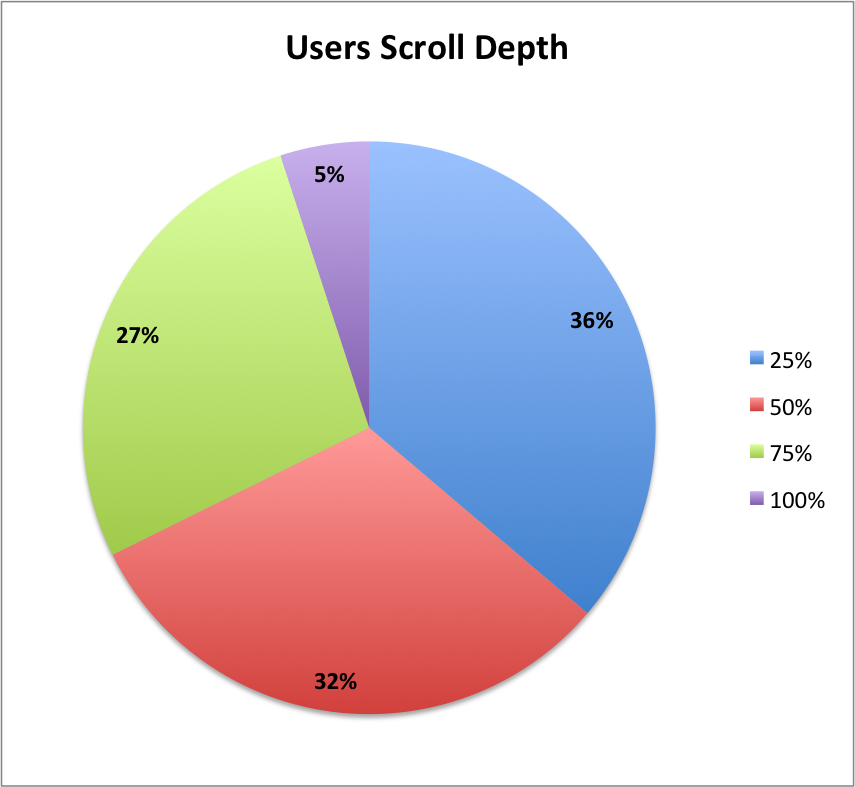
You can export this view out into excel and create a pie chart to make it easier to understand:
Once you have collected more than a few months worth of scroll depth data using a rolling average across all content deployed as part of your content marketing campaigns, is a really great way of having a benchmark to work towards improving. Focusing in on these kinds of metrics and trying to understand a user’s interaction so that you can make positive changes, is directly tied to the returns you will see from your content marketing.
Calculating Return On Investment
When it comes to calculating the ROI of content each site will have different goals and funnels to consider so the way of calculating ROI may differ slightly. The following example covers how to calculate ROI in its simplest form assuming you know the conversion rate and life time value of a user.
The main three metrics you are going to need to work out the ROI of your content are:
- LTV (Life Time Value) – this is the total amount of revenue that user will drive over the lifetime of them being a customer of yours. You can get this information by looking at historical data to find out the average order value and multiplying it by the average number of orders an individual will make in their “lifetime” of being your customer.
- CVR (Conversion Rate) – initially using the site average will be a good starting point, then as your content marketing develops you can look to isolate the conversion rate for the content you are publishing.
- Cost – you need to know how much it is costing you to produce each piece of content, so resource costs such as design time, copywriting etc will need to be accounted for.
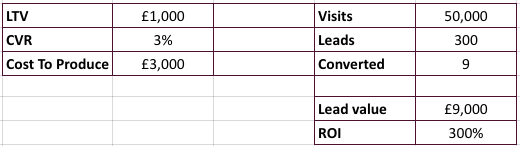
The table above is populated with dummy data to illustrate how it would look using lifetime value and cost to produce content, to work out the return on investment. So in the example, we receive 50,000 visits which drives 300 leads (this could be enquiries or whatever your defined goal is). From the 300 leads at a 3% conversion rate this generates 9 converted customers or purchases, with the cost of production for this piece of content coming out at £3,000 that delivers a return on investment of 300%. This can be broken down into more granular levels even looking at single visitor value, to work this out you would divide the lead value by the amount of visits, for the example above it would £0.18 per visitor.
Why This Combination Wins
The reason why reporting the engagement metrics covered and using the above method to report on ROI works so well, is the relationship between engagement and ROI.
Splitting these things out or looking at metrics that have no real impact on bottom line revenue is where a lot of people go wrong. Using this method and approaching it with the mindset that one cannot work without the other is the right approach, engagement is intrinsically linked to your ability to impact how effective your content is, and in turn how much return on investment you get.
So the more data you collect on how people are engaging with your content the more optimisation you will be able to do, and if that optimisation is actionable and based on user behaviour then you will inherently increase how effectively your content does what it is you created it to do, drive leads whatever that looks like for you.


