


Attributing Metrics To External Events In Google Analytics
Written by Daniel
intro.
You probably heard about O2’s major outage last Thursday. O2 customers around the UK woke up to discover they had no access to either 3G or 4G networks. In 2018, this basically means Armageddon.
The outage was first reported at around 5.30am on Thursday morning, with some customers still experiencing issues into the early hours of Friday. In total, it impacted a whopping 25 million direct O2 customers, as well as a further 7 million customers through its affiliate networks such as Lycamobile, Tesco Mobile & Giffgaff. The disruption also caused issues for O2’s business customers including Sainsbury’s, NHS England and Transport for London. As you can guess, people weren’t happy about it at all.
When O2 was down yesterday. pic.twitter.com/EHmuE6Wlk9
— obicolkenobi™ (@obicol) December 7, 2018
It’s my wife’s birthday and I’m away from home. Have tried calling her all morning but calls don’t connect… can you write me the phone-network-crashing equivalent of an absence note, so I don’t get in trouble with my wife?
— Kieran File (@KieranFile) December 6, 2018
@O2 I have no signal. No network. My phone is basically an iPod with no music.
— Shane Jordan (@smj1104) December 6, 2018
As one of the most popular mobile networks in the UK, with a 26% market share, it makes sense that most businesses will have experienced a dip in website traffic following the outage. But how can you be sure?
What if your website traffic usually dips on a Thursday anyway? Maybe you also happened to have a quiet day on social? Or what if you lost a load of off-site links on the same day? How can you attribute this dip in traffic to the O2 outage, or to any other external events that may occur in the future?
Google Analytics.
But unfortunately, it’s not just that simple. Whilst Google Analytics can be a really easy way to track your website performance, it’s never any good saying “We’ve experienced a dip (or even a spike) in website traffic, but we don’t know why”. Therefore, it can often take a lot of digging around in Google Analytics in order to find the information you need.
We’re here to save you some time. Below, we take you through some steps to help match up your Analytics data with real-life events.
-
Pinpoint The Event
The first step with attributing your metrics to an external event is to actually pinpoint what this event was. In this case, it’s the O2 outage. But there’s an endless list of other potential events depending on your industry, the product that you’re selling and so on. For example, it’s likely that pubs, restaurants and gambling websites will have seen a huge spike in traffic during the World Cup.
-
Set Your Timeline
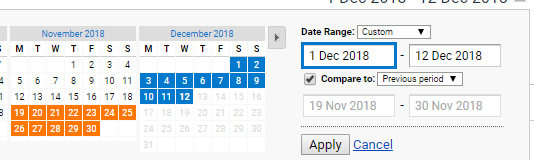
It’s useful (but not necessarily crucial) to know what date/s the event took place. This will allow you to set your Analytics view to the correct time period. It will also allow you to compare your existing data to a dataset from a similar time period, whether that is the ‘Previous Period’, ‘Previous Year’ or a custom set of dates that you feel makes sense.
You can even filter your timeline view by ‘hourly’, which can be great for analysing the impact of any events that took place over a shorter period of time. In this case, the event only occurred on Thursday 6th December 2018. It could also be useful to annotate the event within Google Analytics, this way you won’t forget about it during any longer-term reporting.
-
Find The Right Data
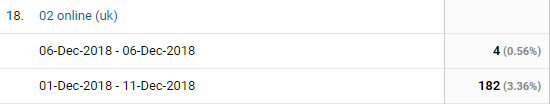
Next, it’s time to match up the event to the relevant category within Google Analytics. For the O2 outage, this is fairly straightforward as the event only impacted a very specific group of people. Mobile network happens to be a category within the ‘Audience’ section of Analytics, under ‘Technology’, which makes this even easier. In this case, we can see that O2 customers make up 3.36% of our total website visitors for this month-to-date. Compare this to website traffic on Thursday 6th December and we can see that O2 customers make up just 0.56% of our total website visitors. Quite a difference.
Now, for an event as significant as the World Cup the implications could be very different; it’s likely to impact a much broader range of metrics than something like the O2 outage. As a gambling website, you may have noticed an increase in new website visitors, an increase in mobile users or maybe even an increase in visitors of a specific demographic. As a pub or restaurant, you may have noticed an increase in website visitors from a specific city (if you operate in various locations), an increase in organic website traffic or maybe even an increase in the number of people visiting a specific landing page.
-
Put The Data Into Action
Once you find the data that you’re looking for, the list of things you could do with it is literally endless. At very minimum, it will allow you to say to your board, marketing team or clients “We’ve seen a dip in website traffic by 2,000 sessions compared to last month. We ran some reports in Analytics and discovered that we had 5,000 less sessions from the O2 network on 6th December, which happened as a result of the UK-wide O2 outage. With this in mind, we actually had a fairly strong month.”
But there are so many other things that you could do with your data. Say you noticed an increase in people from Leeds visiting your pub’s website during the World Cup; this suggests that people want to visit your pub to watch the games. With this information, you could put together some marketing campaigns across social media to advertise that you’re showing the World Cup games, encouraging even more footfall. Maybe you noticed an increase in the number of people visiting the contact page of your restaurant’s website between 5-10pm? With this information, you could ensure that additional staff are on-hand to answer the phone or monitor emails between these times. Be creative and there’s no limit to what you could come up with.
-
Keep Digging
Whilst a lot of marketers may be happy with this discovery by itself, it doesn’t hurt to spend some time digging a bit deeper. For example, whilst looking at our site’s traffic through December I noticed that the 6th was actually our best-performing day of the month so far.
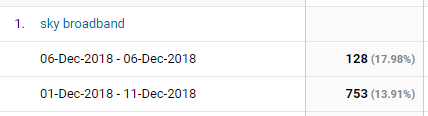
This intrigued me. So I had another look at the ‘Network’ section to see if O2 users had used another network to access our website. Funnily enough, I noticed a spike in website visitors from the Sky Broadband network; usually bringing in 13.91% of website traffic but bringing in 17.98% of website traffic on the 6th December. This suggests that O2 customers chose to access our website through the broadband at their home or place of work instead.
Although this particular data may not mean much by itself, it’s just an example that you can discover some really interesting things by digging that little bit further. If anything, data like this allows you to understand your target audience even better than before. And who knows when it may come in handy in the future.
Google Analytics really is a powerful platform that offers so much value to any business with a website. The growing role of data in marketing is certainly justified when you think about the insights it can offer your business.
Want to discover more digital marketing tips and tricks? Why not sign up to our mailing list for all the latest insights from Flaunt Digital?


